Our use of cookies

We use cookies to tailor your experience, gather analytics, and provide you with live assitance. By clicking "Accept" or continuing to browse our site you agree to the use of cookies. For more details please read our Cookie Policy.

AxioWorks | Data Viewer, Easily display external data in SharePoint as tables or charts

Data Viewer

Easily display external data in SharePoint as tables or charts

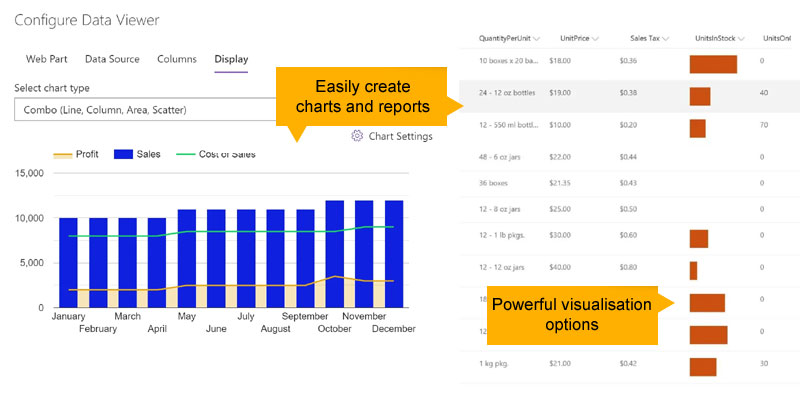
Data Viewer can be a grid view or a chart enabling you to build powerful dashboard easily within the context of a SharePoint Team Site or Microsoft Teams Tab.

Efficient Data Integration and Visualisation with Data Viewer

Data Viewer is a powerful tool designed to enable business users, regardless of their expertise in data modelling or business intelligence, to effortlessly create clear and user-friendly reports and charts directly within their SharePoint pages or Microsoft Teams tabs. This tool simplifies the process of data visualization: users can easily connect to a variety of data sources, such as SQL Server databases, Excel workbooks, SharePoint Lists, or external data sources.

Serves as an excellent alternative to Business Connectivity Services (BCS), which is slated for phasing out by the end of 2024.
 

Data Viewer


Features at a glance:

  • Customizable Reports and Charts - Easily created and tailored to business needs.
  • Data Integration - Connects to SQL Server, Excel, OData, and SharePoint lists.
  • No Expertise Required - Simple for any business user to use, without needing data modeling or business intelligence skills.
  • Build Data Reports - Allows creation of detailed reports with conditional formatting and calculated columns.
  • Dynamic Chart Display - Offers a variety of chart types, including 3D and 2D, Pie, Bar, Column, Line, Scatter, Donut, and Surface charts.
  • Compatibility with SharePoint & Teams - Can display data in reports or charts on SharePoint pages or Microsoft Teams tabs.
  • Ease of Use - User-friendly interface for building reports and charts.
  • Conditional Formatting - Highlights key data with colors, icons, or data bars.
  • Grid or Chart Display - Can be used as a data grid or chart in SharePoint or Microsoft Teams.


Build Data Reports

Build powerful reports on SharePoint List content or External Data Sources. Define the columns to display and without code include multiple level groups, conditional formatting, and calculated columns to highlight key data that requires action.

Display Dynamic Charts

Build dynamic, simple to use 3D or 2D charts on your internal or external data sources. Charts include Pie, Bar, Column, Line, Scatter, Donut and Surface charts. The charts are interactive and fully customizable.

For SharePoint & Teams

Display your internal content or external data in Microsoft SharePoint pages or Microsoft Teams tabs. Users will benefit from having data in the form of reports or charts right at their finger tips whilst collaborating in SharePoint and Teams.

Lightning Forms Pricing

Data Viewer
Base

$1,950/year (USD)

Plus $1.96 Per user per year
($0.16 per user per month)

  • Dedicated Customer Success Manager
  • Email, Telephone and Remote Desktop Support
  • All updates & Hotfixes
  • 30 Day Money Back Guarantee


Get a Quote

Lightning Forms is licensed per SharePoint user (Number of SharePoint Profiles within the tenant). The price is based on an annual subscription.

Data Viewer
Enterprise

Pricing Upon Request

For installations of
over 10,000 users

  • Dedicated Customer Success Manager
  • Email, Telephone and Remote Desktop Support
  • All updates & Hotfixes
  • 30 Day Money Back Guarantee
  • Microsoft Teams based end user training
  • 24 hour support line


Get a Quote

Data Viewer is licensed per SharePoint user (Number of SharePoint Profiles within the tenant). The price is based on an annual subscription.

Learn more

DISPLAYING EXTERNAL DATA WITHIN SHAREPOINT OR MICROSOFT TEAMS

The Data Viewer Client Side Web Part can be configured by Business Users within a few minutes to display Line of Business Data from Data Sources such as Excel,  SQL Azure, Business Connectivity Services, OData and SharePoint Lists.  Connections to your organizations data such as Customer Relationship Management Systems, Accounting Systems, or Custom Databases can be connected to easily, allowing business users to benefit from viewing live up-to-date business information within the context of their SharePoint Team Sites or Microsoft Teams Tabs.

HIGHLIGHTING KEY BUSINESS DATA (NO CODE)

Use conditional formatting to highlight key business data. Overdue Tasks, Low Stock, Currency Exchange Rates, Sales Revenue are examples of data that you need to highlight visually allowing for a quick reaction time. Key Financial Indicators and Key Performance Indicators can be configured with a simple dialog and no need to write any code. Simply choose colours, icons or data bars to highlight your key data.

SELECT AND STYLE YOUR ICONS

Choose Icons as part of your conditional formatting to make data stand out. The Office 365 Fabric icons can be selected and styled and applied to cell values. Pepper pots, Smileys, Envelopes and more icons are available. In fact there are hundreds to choose from enabling you to highlight data that you need to act upon.

DATA VIEWER CAN BE A GRID OF DATA OR A CHART IN SHAREPOINT OR MICROSOFT TEAMS

The Data Viewer can be used within Microsoft SharePoint Modern Sites or Microsoft Teams Tabs as a Grid of Data with styling or as a Chart which can be configured easily. The Charting Feature allows for Pie, Donut, Column, Line, Area, and Scatter Charts which can all be configured easily and displayed in 2D or 3D.

TREEMAPS

Display summary information within a TreeMap next to the detail! Users will be able to see trends, and how the business is performing  using the TreeMap view of data.

CHARTS AND GAUGES

The Data Viewer allows you to represent your data in multiple ways using Gauges, TreeMaps, Multiple Series Charts, and Pie Charts.

BUILD POWERFUL AND INFORMATIVE DASHBOARDS

The Data Viewer can be a grid view or a chart enabling you to build powerful dashboard easily within the context of a SharePoint Team Site or Microsoft Teams Tab.

Get SharePoint and SQL news to your inbox

Stay up-to-date with industry news and trends, SQL and SharePoint innovations and all the latest from AxioWorks by subscribing to our monthly newsletter.

Subscribe to the AxioWorks newsletter

*